Infographic Size Guide: Best Dimensions for Web, Print, Canva & Social Media
In this guide
- Quick Infographic Size Chart
- What Is the Standard Infographic Size?
- Best Infographic Size for Websites and Blog Posts
- Infographic Size for Social Media
- Infographic Size for Print, PDF, A4 and US Letter
- What Size Is an Infographic on Canva?
- Infographic Size in Inches, Centimetres and Pixels
- Infographic Aspect Ratio: Which Ratio Should You Use?
- How to Choose the Right Infographic Size
- Best File Formats for Infographics
- What Size Font Should You Use for Infographics?
- Is an Infographic One Page Only?
- Infographic Size in Photoshop and Other Design Tools
- Common Infographic Size Mistakes to Avoid
- Test Your Infographic Before You Publish
- FAQ About Infographic Sizes
- How We Compiled These Sizes
- Before Your Next Infographic
By [Author name], [role] · Last reviewed: 10 September 2026
There is no standard infographic size. The right size depends on where you publish it.
That sounds like a dodge, so here are the numbers first. For a blog post, design at about 800 px wide and let your content set the height. For print, use A4 or US Letter at 300 PPI and export a PDF. For a social feed, match the platform’s shape or split the graphic into a carousel.
Get it wrong and Instagram crops your title, the print comes back blurry, or your text shrinks to nothing on a phone.
Quick Infographic Size Chart
| Use case | Size in pixels | Ratio | Best format | Notes |
|---|---|---|---|---|
| Blog or website | ~800 wide, 2,000–3,000 tall | Flexible | PNG, WebP | Your column sets the width |
| Classic long infographic | 1,000 × 6,000+ | ~1:6 | PNG, JPG, SVG | Agency-style format |
| Pinterest pin | 1,000 × 1,500 | 2:3 | JPG | All uploads become JPEG |
| Tall Pinterest pin | Up to 1,000 × 2,100 | Up to 2:4.2 | JPG | Taller pins get cut off |
| Instagram square | 1,080 × 1,080 | 1:1 | JPG, PNG | Safe on every feed |
| Instagram portrait | 1,080 × 1,440 | 3:4 | JPG, PNG | 1,080 × 1,350 also works |
| Instagram Stories, Reels | 1,080 × 1,920 | 9:16 | JPG, PNG | Ad spec is 1,440 × 2,560 |
| LinkedIn landscape | 1,200 × 628 | 1.91:1 | PNG, JPG | From LinkedIn ad specs |
| LinkedIn square | 1,200 × 1,200 | 1:1 | PNG, JPG | Standalone graphics |
| LinkedIn document | No size published | Any | Up to 300 pages, 100 MB | |
| Facebook feed | 1,440 × 1,800 | 4:5 | JPG, PNG | Meta’s current feed spec |
| Link preview image | 1,200 × 630 | 1.91:1 | JPG, PNG | Not the feed size |
| X (Twitter) | No size published | 2:1 to 3:4 | JPG, PNG, WebP | Keep files under 5 MB |
| Presentation slide | 1,920 × 1,080 | 16:9 | PNG, PDF | One idea per slide |
| A4 print | 2,480 × 3,508 at 300 PPI | 1:1.414 | 210 × 297 mm | |
| US Letter print | 2,550 × 3,300 at 300 PPI | 1:1.294 | 8.5 × 11 in | |
| A3 print | 3,508 × 4,961 at 300 PPI | 1:1.414 | 297 × 420 mm | |
| 600 px wide | Flexible | JPG, PNG | Crop it, link to the full file |
Print sizes never change. Social specs do, so confirm them before a big campaign. File size counts too: images make up roughly 37% of a median web page’s weight, per the HTTP Archive Web Almanac.
What Is the Standard Infographic Size?
There is no single standard. Practice clusters around 800 to 1,000 px wide, with height set by your content.
The two best-documented sources disagree, which tells you something. Venngage recommends about 800 px from its own data: average width 870 px, median and mode 800 px. Agency Lemonly ships client work at around 1,000 px wide by 6,000+ px tall. Both are right, for different destinations.

Best Infographic Size for Websites and Blog Posts
Width matters most, because your content column is fixed.
Use 600 px for narrow columns and email, 800 px as a safe default, and 1,000 px for detailed graphics. Do not guess: right-click your post, choose Inspect, hover over the article container, and read the width. Export at twice that width so text stays sharp on high-resolution screens.
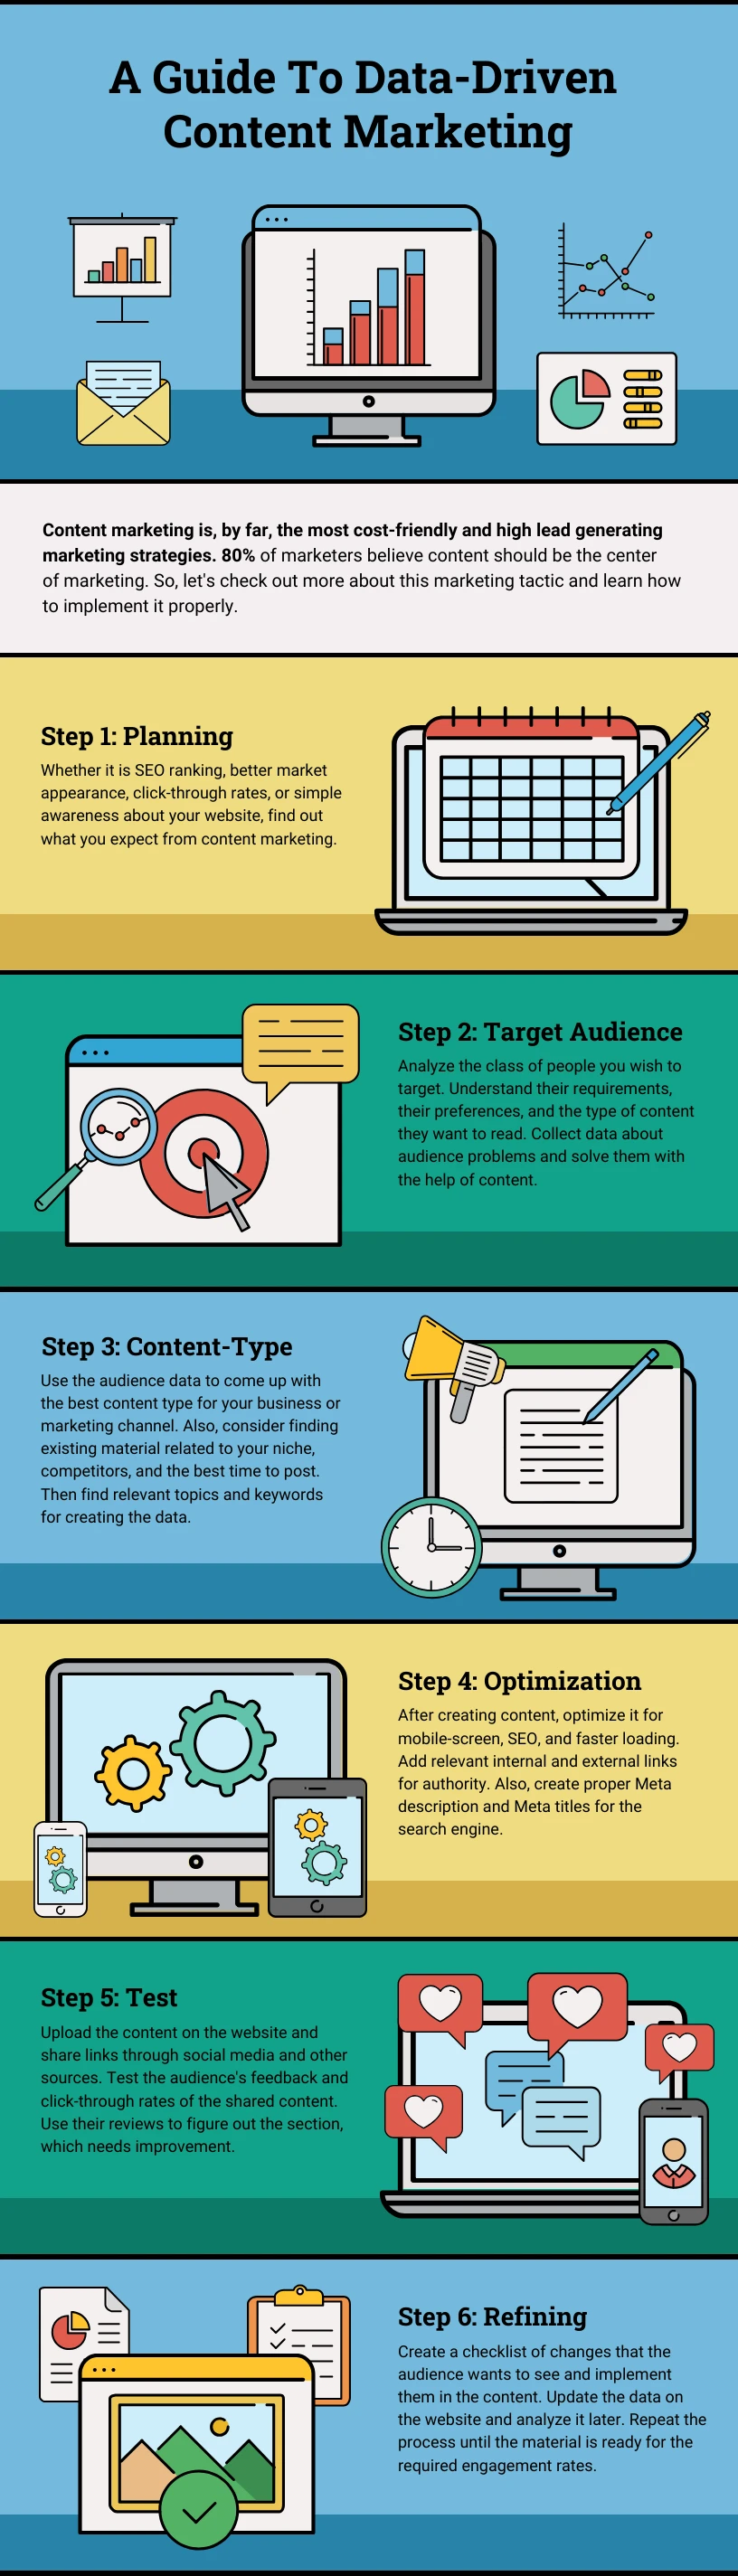
Height follows your content, but people stop scrolling. Nielsen Norman Group’s eyetracking study of 120 people found 74% of viewing time lands in the first two screenfuls, about 2,160 px. Put your strongest point above that line, and split anything past 6,000 px into a series.
Upload and File Size
Your site has an opinion about your image, and it wins. One WordPress user uploaded a 620 × 5,953 px infographic and watched the site quietly shrink it. Lemonly warn that “some website backends don’t want to cooperate with an image over a certain number of pixels wide or long.”
Squarespace caps uploads at 20 MB and recommends 500 KB. Shopify rejects anything over 20 MB or 25 megapixels. Aim for under 1 MB, and turn lazy loading off if the infographic sits at the top of the page. Speed matters because Google measures it: Largest Contentful Paint counts as good at 2.5 seconds or less.
Infographic Size for Social Media
Feeds crop by shape, not by pixel count. A tall infographic cannot survive one intact.
Instagram keeps your original resolution when the width sits between 320 and 1,080 px and the ratio falls between 1.91:1 and 3:4. At 1,080 px wide, that means a height of 566 to 1,440 px. Instagram crops anything outside that range.
Square is 1,080 × 1,080 px. Portrait tops out at 1,080 × 1,440 px, though 1,080 × 1,350 still works and stays the ceiling for ads. Stories start at 1,080 × 1,920 px, and Meta’s ad spec is 1,440 × 2,560 px. Keep Stories text out of the top 14%, the bottom 35%, and the outer 6% of each side.

Correct pixels still do not guarantee a sharp post. Instagram re-compresses uploads, and compression punishes thin fonts hardest.
Pinterest recommends a 2:3 ratio, or 1,000 × 1,500 px. Its published threshold truncates pins past 2:4.2, about 1,000 × 2,100 px, so the widely repeated “1,000 × 3,000 tall pin” exceeds the limit by 43%. Put your headline at the top, because that is all a truncated pin shows. Pinterest also converts every upload to an 8-bit RGB JPEG, so a lossless PNG buys you nothing.
LinkedIn publishes no pixel size for organic posts. These come from its advertising specs: landscape 1,200 × 628 px, square 1,200 × 1,200 px. Organic uploads cap at 36 megapixels and 100 MB. For a long infographic, use a document post: LinkedIn turns a PDF of up to 300 pages into a swipeable carousel.
Facebook’s current feed spec is 4:5 at 1,440 × 1,800 px, maximum 30 MB, per Meta’s ads guide. The familiar 1.91:1 figure belongs elsewhere: for the preview shown when someone shares your link, Meta recommends 1,200 × 630 px. Two images, two jobs.
X (Twitter)
X no longer publishes a recommended in-feed size. Most guides still quote 1,200 × 675 px as if it were official; it is a community convention. X does document the limits: images up to 5 MB in JPG, PNG, GIF, or WebP, and four photos per post. A single photo shows in full between 2:1 and 3:4, so post a teaser and link to the full graphic.
Infographic Size for Print, PDF, A4 and US Letter
An infographic can be A4, but only if you plan to print it or build a PDF handout. A4 is a paper standard, not an infographic standard.
| Print size | Inches | Centimetres | Pixels at 300 PPI |
|---|---|---|---|
| A4 | 8.27 × 11.69 | 21 × 29.7 | 2,480 × 3,508 |
| US Letter | 8.5 × 11 | 21.59 × 27.94 | 2,550 × 3,300 |
| A3 | 11.69 × 16.54 | 29.7 × 42 | 3,508 × 4,961 |
A4 and A3 share the same 1:1.414 ratio, because ISO 216 built the A series on it, so one design fits both. US Letter is wider and shorter, which is why an A4 template printed on Letter paper loses content at the edges.
Use 300 PPI at final print size. Offset presses use a 150 lines-per-inch screen, and resolution should be twice that. PrintNinja caps submissions at 400 dpi because presses cannot reproduce more.
Do not raise the DPI number to fix low resolution. Converting a 72 dpi file to 300 dpi “doesn’t improve quality, it only enlarges pixelated content.”
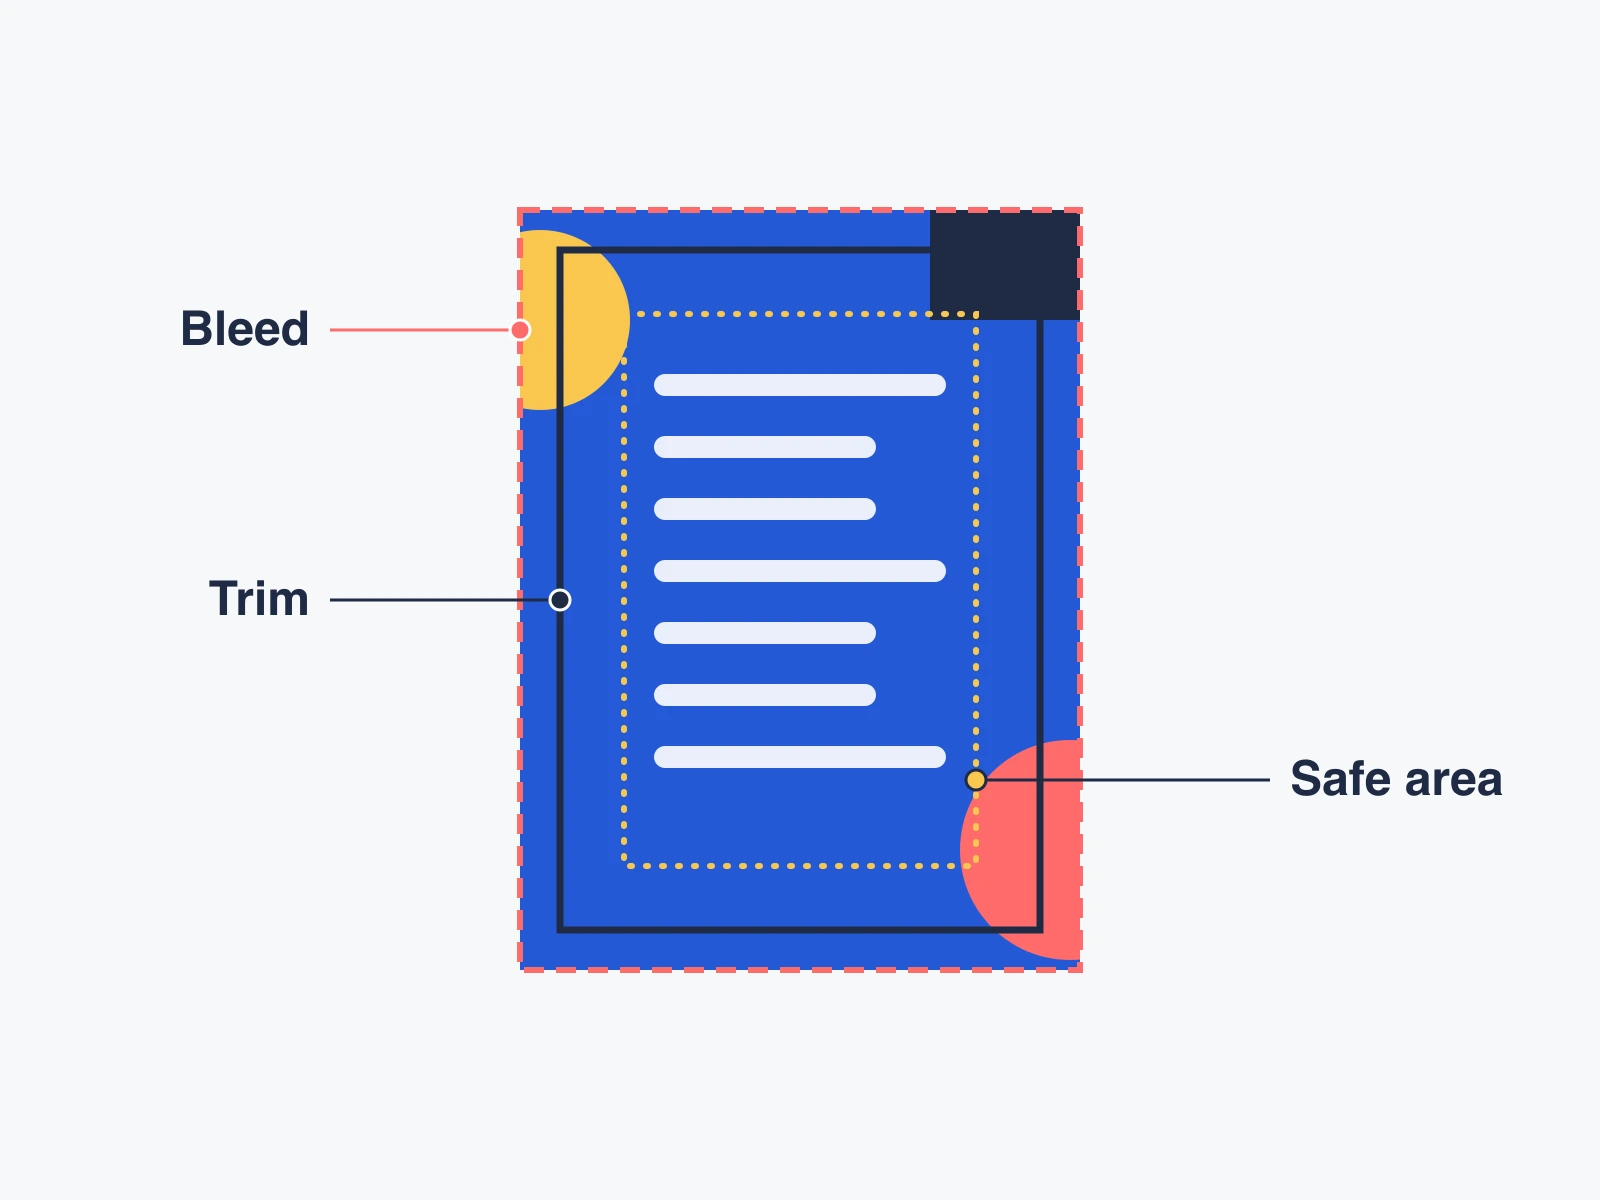
Add bleed if colour touches the edge. Bleed is extra artwork past the cut line that the printer trims away. The standard is 3 mm, or 0.125 in on all four sides, because the blade can stray that far. Keep text at least 3 mm inside the trim.
Export as PDF/X-1a or PDF/X-4, which force CMYK colour, embedded fonts, and flattened transparency.
What Size Is an Infographic on Canva?
Canva does not publish one official infographic size.
You will see 800 × 2,000 px repeated everywhere as “the Canva size.” We could not trace it to any page Canva owns; every citation leads back to another blog. Canva’s templates come in a range of dimensions, and the template you pick sets your canvas.
Here is what Canva does define. Custom designs must sit between 40 px and 8,000 px per side. And your download choice decides print quality: PDF Standard exports at 96 dpi, PDF Print exports at 300 dpi with bleed, crop marks, and a CMYK option, per Canva’s help centre. That one dropdown explains most blurry Canva prints.
So pick the destination, then set the canvas: 1,080 × 1,440 for Instagram, 1,000 × 1,500 for Pinterest, an A4 document for print, 1,920 × 1,080 for slides, about 800 px wide for a blog. One warning: resizing changes the canvas, not the layout, so a tall design squeezed into a square needs manual repair.

Infographic Size in Inches, Centimetres and Pixels
Use pixels for screens, inches or centimetres for print, and PPI to convert between them.
Pixels describe a digital image, and that is all a screen image has. Inches and centimetres describe physical size, which exists only once you print. PPI means pixels per inch and describes your file; DPI means dots per inch and describes the printer. Adobe puts it simply: “DPI is the print output, and PPI is the digital input.”
pixels = inches × PPI
inches = pixels ÷ PPI
cm     = inches × 2.54
pixels = points × (PPI ÷ 72)
Two examples make it click. A4 at 300 PPI: 210 mm ÷ 25.4 = 8.27 in, then 8.27 × 300 = 2,480 px wide. Your 1,080 px Instagram graphic, printed: 1,080 ÷ 300 = 3.6 in, roughly a coaster.
For a large poster you can drop below 300 PPI. Viewing distance forgives a lot, and 150 PPI on a poster seen from a few metres looks close to 300 PPI held in the hand.
Infographic Aspect Ratio: Which Ratio Should You Use?
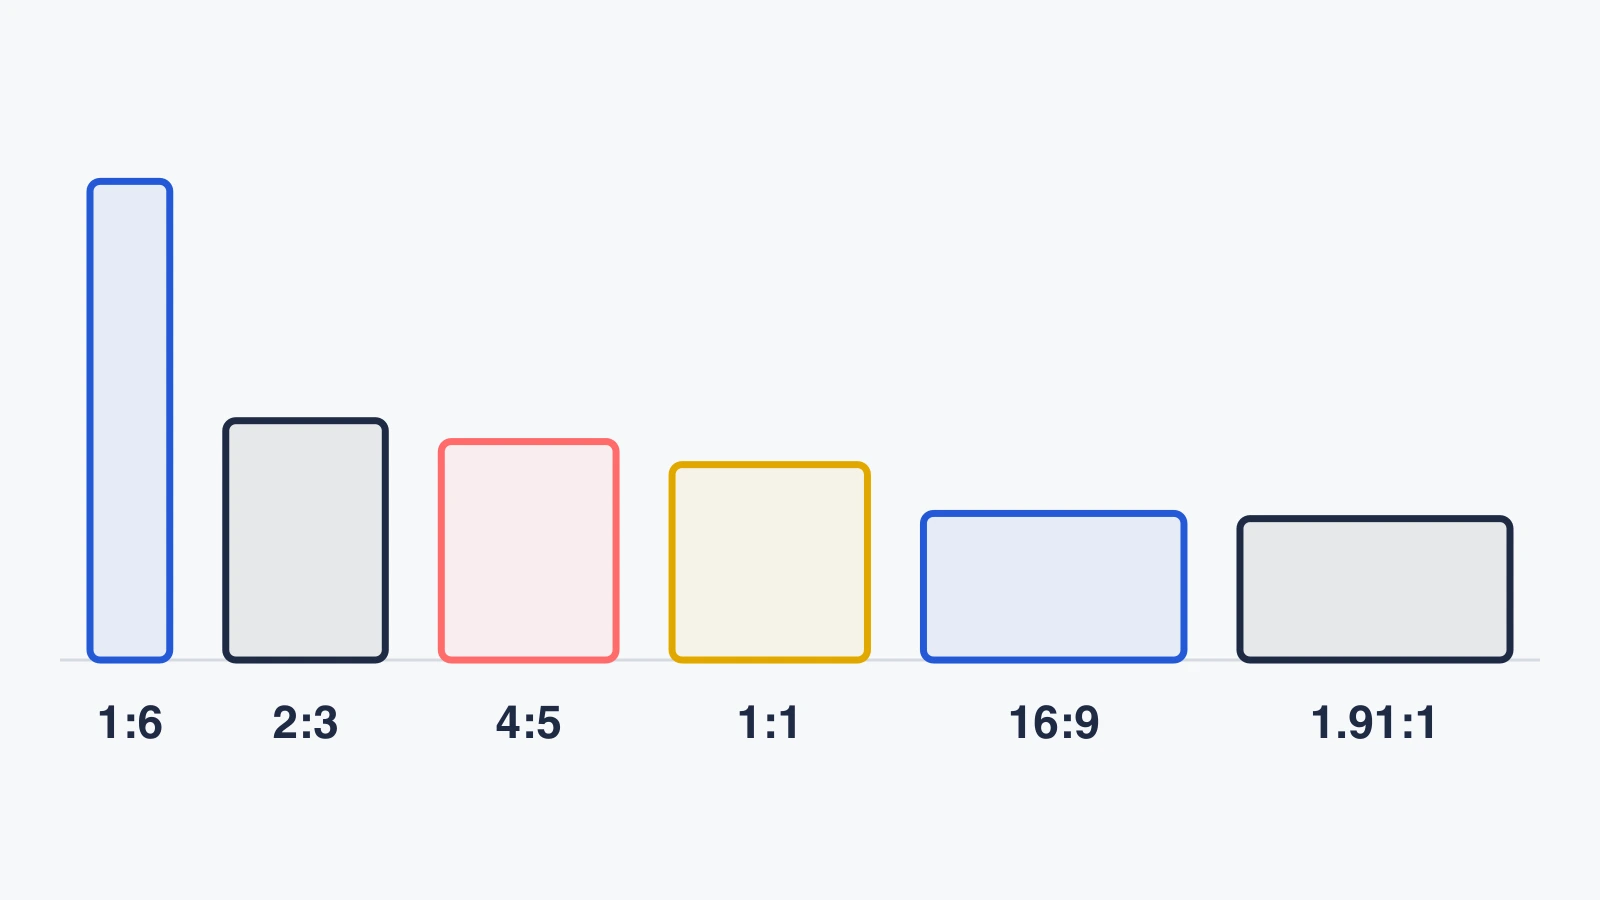
Pick the ratio before the pixels, because ratio is what platforms check. Dimensions are exact width and height. Aspect ratio is the shape.
| Use case | Ratio |
|---|---|
| Blog or web infographic | Flexible |
| Classic vertical infographic | About 1:6 |
| Instagram square, portrait, Stories | 1:1, 3:4 max, 9:16 |
| 2:3, cut off past 2:4.2 | |
| Facebook feed | 4:5 |
| LinkedIn feed and link previews | 1.91:1 or 1:1 |
| Presentation | 16:9 |
| A4 and A3 print | 1:1.414 |
| US Letter print | 1:1.294 |
Google adds a note worth heeding for tall graphics: “Avoid using an image with an extreme aspect ratio.”
How to Choose the Right Infographic Size
Answer four questions before you set the canvas.
1. Where will it live? Each destination has a different hard limit. Gaius J. Augustus, a science communicator who builds infographics for researchers, puts it bluntly: “Don’t plan on an infographic being able to serve you in multiple contexts.”
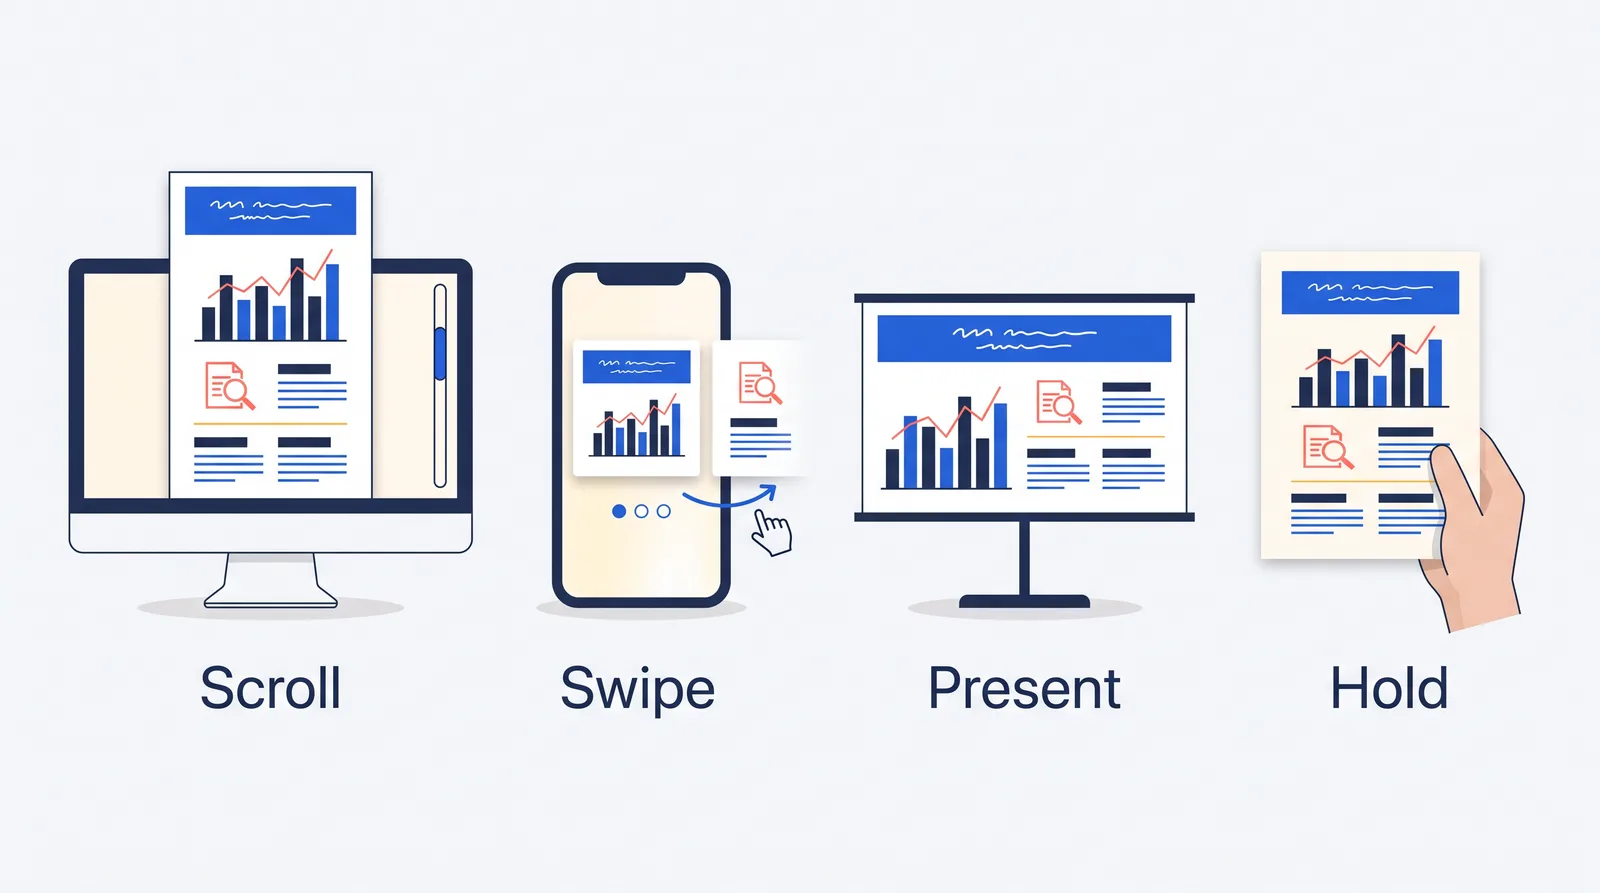
2. How will people meet it? Scrolling suits a tall web graphic, swiping suits a carousel, presenting suits 16:9, holding suits print at 300 PPI. Viewing distance sits underneath all of it: a phone held 30 cm away and a poster seen from 2 m need completely different type.
3. Does your content fit the format? If your text keeps shrinking to fit, the format is wrong, not the text.
4. What are the technical limits? Measure your column, check upload caps and crop shapes, confirm bleed with your printer. Then set the canvas once.
Best File Formats for Infographics
| Format | Best for | Watch out for |
|---|---|---|
| PNG | Text, icons, flat colour, transparency | Larger files than JPG |
| JPG | Photo-heavy infographics | Softens fine text |
| Print, reports, LinkedIn documents | Pick the 300 dpi export | |
| SVG | Vectors that scale to any size | Many sites block SVG uploads |
| WebP | Web performance | Hard limit of 16,383 px per side |
| AVIF | The smallest files | No progressive loading |
WebP has a ceiling. MDN lists a hard maximum of 16,383 × 16,383 px, so a very tall scroll infographic will not encode. Everywhere else it is worth using: files run 25% to 35% smaller than JPEG and about 26% smaller than PNG. AVIF saves roughly 50% against JPEG but loads all at once, so WebP often suits a tall graphic better.
Sites block SVG for a reason. SVG files are XML and can carry JavaScript, so an uploaded SVG becomes live code on your page. WordPress blocks it by default, which is why you see “Sorry, you are not allowed to upload this file type.” Google indexes BMP, GIF, JPEG, PNG, WebP, SVG, and AVIF, and publishes no recommended size at all.
What Size Font Should You Use for Infographics?
Your text shrinks by exactly the same ratio as your image. That is the whole problem, and almost nobody does the arithmetic.
Rendered size = design size × (display width ÷ canvas width)
Run it on a 1,000 px infographic:
| Where it shows | Display width | 16 px becomes | 24 px becomes | 45 px becomes |
|---|---|---|---|---|
| Desktop blog column | 800 px | 12.8 px | 19.2 px | 36 px |
| Narrow column or email | 600 px | 9.6 px | 14.4 px | 27 px |
| Phone | ~358 px | 5.7 px | 8.6 px | 16 px |
On a phone, 16 px canvas text renders at under 6 px, smaller than the fine print on a medicine label. Reverse the formula and you get a rule: body text should be at least canvas width ÷ 25.
| Canvas width | Headline (÷12) | Heading (÷18) | Body (÷25) | Caption (÷33) |
|---|---|---|---|---|
| 800 px | 67 px | 44 px | 32 px | 24 px |
| 1,000 px | 83 px | 56 px | 40 px | 30 px |
| 1,200 px | 100 px | 67 px | 48 px | 36 px |
| 2,480 px (A4) | 207 px | 138 px | 99 px | 75 px |
For print, use 12 pt as your floor, not 9 pt. At 300 PPI that is 50 px. RNIB treats 10 to 12 pt as regular print and 16 to 18 pt as large print, and Washington University’s poster guidance recommends 32 pt body text for a wall poster. WCAG also requires 4.5:1 contrast for normal text and 3:1 for large text.
One accessibility problem nobody mentions: an infographic is an image of text, and WCAG 1.4.5 treats that as a Level AA failure unless a specific look is essential. Zooming does not fix it, because images of text pixelate when scaled. Publishing the same information as real text below the graphic does, and it helps your search visibility too.
Is an Infographic One Page Only?
No. An infographic can be one long scrolling image, a one-page A4 handout, a multi-page PDF, a social carousel, a slide deck, or a series of smaller graphics. LinkedIn accepts documents up to 300 pages, and Lemonly’s standard deliverable is a single 6,000 px file.
The one-page rule usually comes from somewhere else: an assignment brief, or a handout that has to fit a sheet of paper. That constraint comes from the brief or the paper, not from any rule about infographics.
Infographic Size in Photoshop and Other Design Tools
Set the canvas before you design, because rebuilding a layout later rarely looks as good.
Use RGB for screens and CMYK only if your printer asks. For screen exports, pixel dimensions are the only thing that matters; the DPI field does nothing. Photoshop supports WebP from version 23.2, but only through Save a Copy or Save As.
Room to work is not your constraint: a PSD file handles 30,000 px per side. The real ceilings are Canva at 8,000 px and Figma, which downsizes placed images beyond 4,096 px.
Common Infographic Size Mistakes to Avoid
Most size problems trace to one cause: people choose the format after the design starts.
- Designing before picking the platform, so you meet the limit at upload.
- Using one file everywhere. A 1:6 graphic renders intact on none of the major feeds.
- Making text too small. 16 px on a 1,000 px canvas is 5.7 px on a phone.
- Ignoring aspect ratio. Instagram crops, Pinterest truncates.
- Exporting print at screen resolution, or picking Canva’s PDF Standard instead of PDF Print.
- Uploading huge files. Shopify rejects over 20 MB or 25 megapixels; X caps at 5 MB.
- Posting a tall infographic to a feed instead of splitting it into a carousel.
- Forgetting bleed. Anything within 3 mm of the trim edge risks the blade.
- Resizing the canvas without redesigning. Upscaling adds pixels, not detail.
- Skipping the mobile and print test, the one free fix on this list.
Test Your Infographic Before You Publish
Lemonly tell clients to upload a test image to a private page first and watch for four red flags: content cut off, pixelation, scaling problems, and animation failures. Run through this before you publish:
- Zoom your design to 25%. Can you still read the headline and every big number?
- Confirm body text clears canvas width ÷ 25.
- Check colour mode: RGB for screen, CMYK for print.
- Spell-check the image, not the document. Nobody can fix a typo in a published PNG.
- Upload a test file at final dimensions, then view the live page on a real phone.
- Compare the served dimensions in Inspect to confirm your site did not resize it.
- Compress the file and check its size before upload.
- Preview the social crop, and check the thumbnail view.
- Order one print proof, then read it at arm’s length.
- Confirm the PDF page size reads exactly A4 or Letter, not “A4 scaled to fit.”
- Add alt text that summarises the finding, not the format.
- Publish the key data as real text below the image.
- Check colour contrast, and never let colour be the only way you show meaning.
FAQ About Infographic Sizes
Is an infographic A4 size? It can be, if you are printing it or building a PDF handout. A4 is 210 × 297 mm, 8.27 × 11.69 in, or 2,480 × 3,508 px at 300 PPI.
What size is an infographic on Canva? Canva publishes no official size, and the widely quoted 800 × 2,000 px figure traces to third-party blogs. Custom designs must sit between 40 and 8,000 px per side.
Can Canva export at 300 DPI? Yes. Choose PDF Print. PDF Standard exports at 96 dpi and prints blurry.
Is an infographic one page only? No. It can be one long image, a one-page handout, a multi-page PDF, a carousel, or a deck.
What size font should I use? At least canvas width ÷ 25 for body text, so 32 px on an 800 px canvas. For print, 12 pt minimum.
What is the best infographic size for a website? About 800 px wide, height set by content, starting around 2,000 to 3,000 px.
What is the best size for a PDF? A4 at 2,480 × 3,508 px or US Letter at 2,550 × 3,300 px, both at 300 PPI.
Why is my infographic blurry after upload? Your site probably resized it. Check the served dimensions in Inspect against what you uploaded.
Can one infographic serve web, print and social? Usually no. A 1,000 × 6,000 px graphic is 1:6, outside Instagram’s limits and past Pinterest’s cut-off. At 300 PPI it prints just 3.3 in wide.
How We Compiled These Sizes
Print dimensions come from the paper standards: ISO 216 for the A series and the ANSI convention for Letter. We calculate every pixel figure with pixels = inches × PPI, and we show the arithmetic above so you can check it.
Social specs come from each platform’s own help centre or developer documentation, checked on 10 September 2026. Where a platform no longer publishes a recommended size, we say so rather than repeat a number from another blog. That applies to X and to LinkedIn’s organic feed.
Instagram’s supported ratio has changed more than once recently, and Facebook’s feed spec moved from 1.91:1 to 4:5. Treat the print tables as settled and the social table as a starting point. Next review: March 2027.
Before Your Next Infographic
Pick the destination first. Everything else follows.
- Decide where you will publish it.
- Choose the dimensions or ratio that destination requires.
- Check your body text clears canvas width ÷ 25.
- Export in the right format: PNG or WebP for web, PDF Print for paper.
- Test it on a phone, in your CMS, or as a printed proof.
Save the chart before you open your design tool. Ten seconds now saves a rebuild later.